Android Application: Show captured sound in time (Osciloscope) and frequency (Spectrum, Spectrogram).
Analyze sound you hear with your smartphone or tablet. See sound content in time and frequency in identify leading frequencies. With this tool you can analyze any sound you wish (playing instrument, singing, whistle, car engine, animal sounds, etc...)
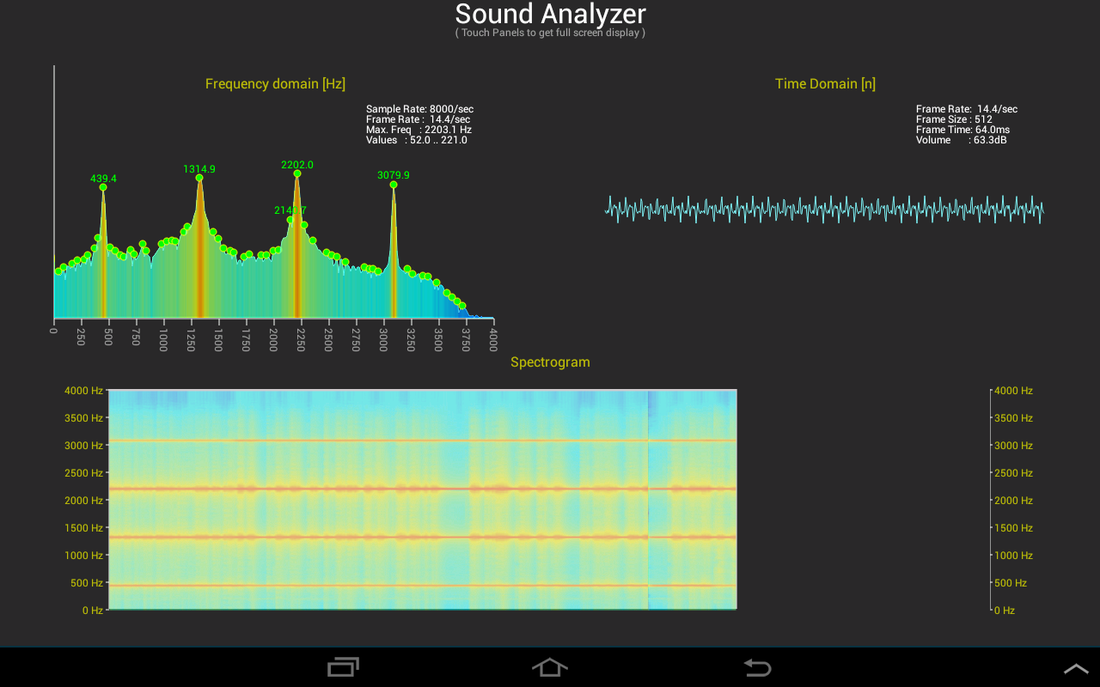
Analyse captured audio from microphone in three separate panels:
- Osciloscope (time domain),
- Spectrum (instantaneous frequency domain),
- Spectrogram (accumulative frequency domain).
You can display all panels at once (default screen). If you want to see each panel at full-screen, you can simply click on panel and will be shown full-screen with additional settings that can be changed by pressing buttons. Display can also be paused to take screenshots.
In Spectrum panel values of one or five leading frequencies can also be displayed. Linear or Logarithmic magnitude scale can be chosen.
Note:
The internet permissions are used for ads only.
 RSS Feed
